Data-first framing and the problem statement
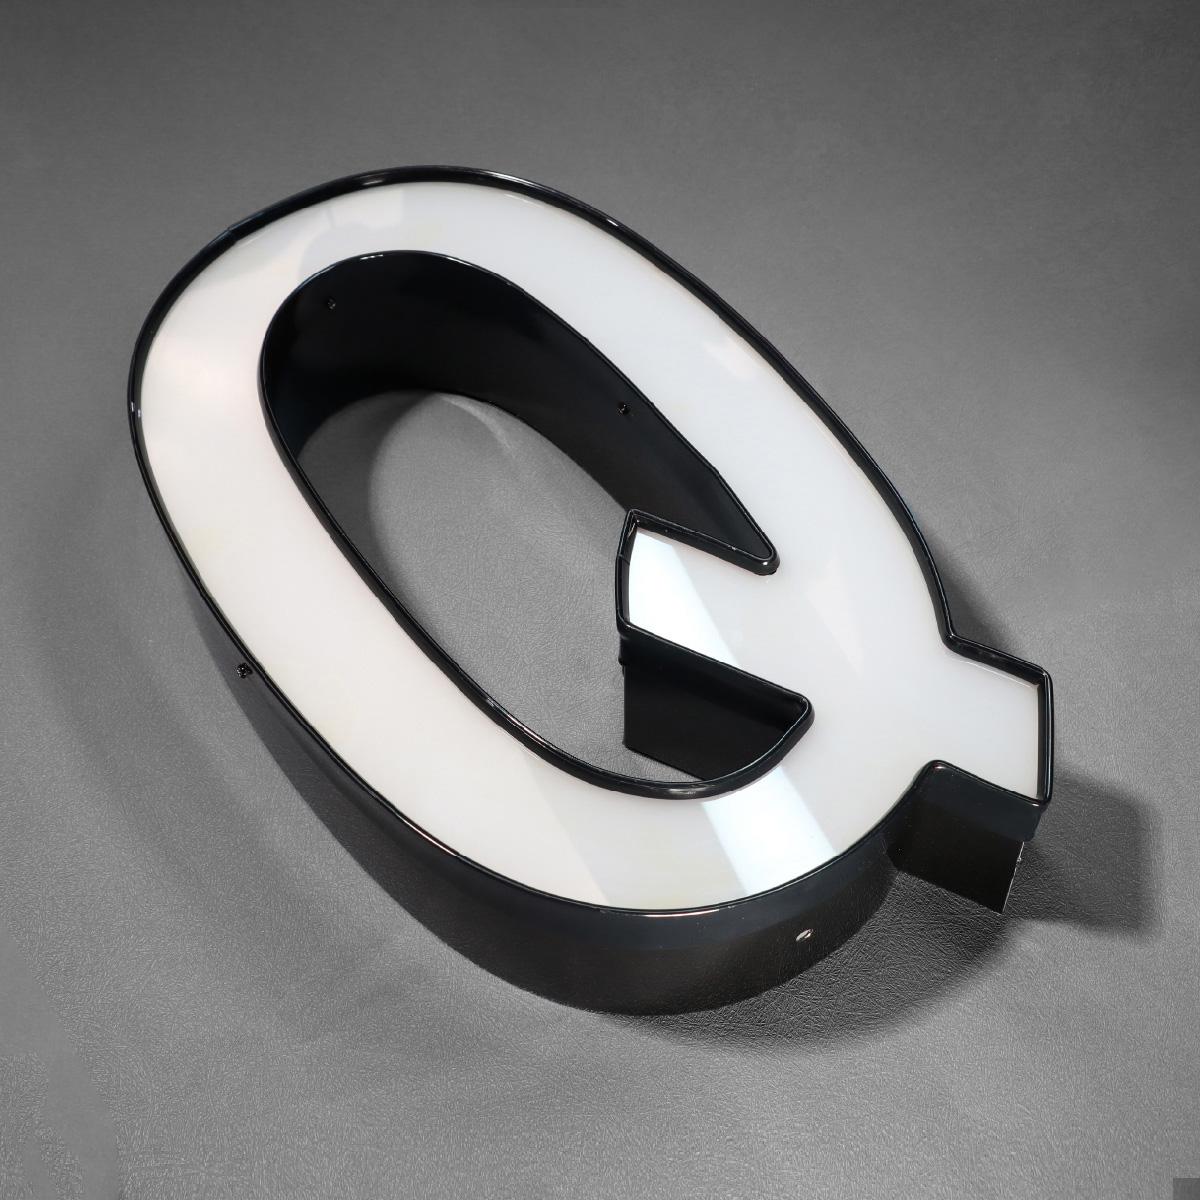
Industrial parks require consistent, legible signage under all weather and shift conditions; uneven illumination creates safety risks and operational delays. A data-driven approach begins with a lab-grade photometric map of each sign type and mounting condition — measuring lux, lumen output, and beam angle across the face — and applying those results to real-world layouts, especially for digital wayfinding signage. This step reduces guesswork: lux targets get verified, glare is quantified, and decisions about optics or shield placement rest on numbers rather than aesthetics.
Core measurements and equipment checklist
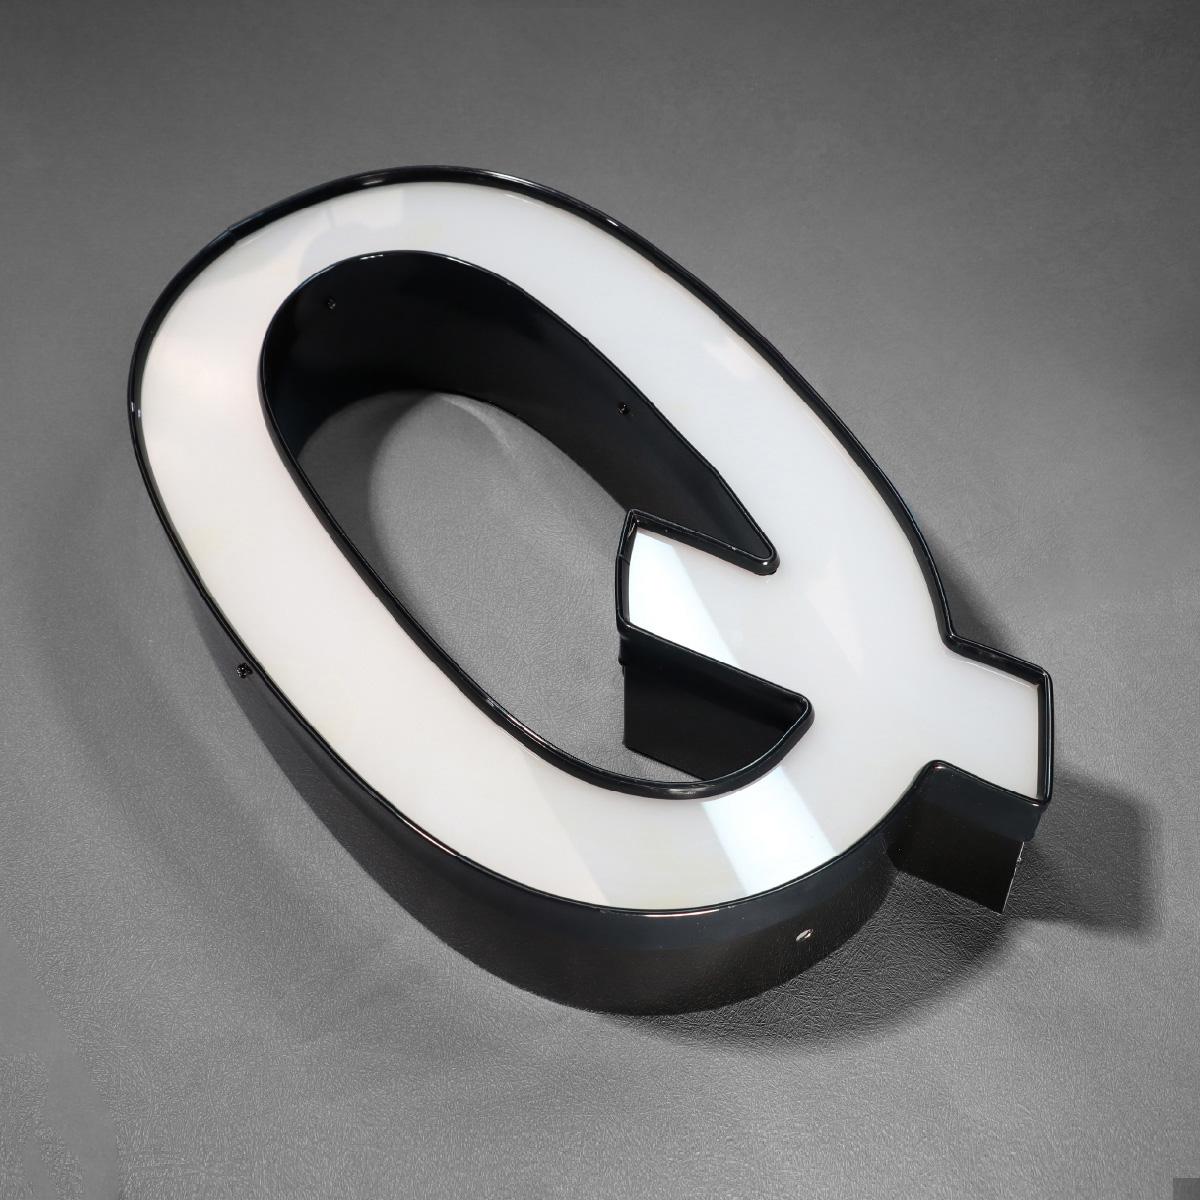
Run a consistent test matrix: lux grid readings at standard distances, spectral checks for CRI, and thermal cycling to estimate lumen maintenance. Use a calibrated lux meter, an integrating sphere or photometric goniometer for small modules, and temperature-controlled enclosures when testing LEDs. Record beam angle and photometric curve for each lamp assembly; these two values drive how quickly a hotspot appears across a backlit panel.
Translating lab curves to site layouts
Apply the photometric curve to the sign geometry and mounting height. Model horizontal and vertical lux distribution across the panel, then overlay the mounting hardware’s shadow patterns. Field anchors matter: logistics hubs around Rotterdam routinely require tighter uniformity because large vehicle lanes create longer sightlines — a fact that shows up in measured lux falloff. Use software or even a spreadsheet to convert candela distributions into lux at chosen observation planes.
Common failure modes and mitigation — practical checklist
Most hotspot issues fall into predictable categories:
– Over-driven LEDs with narrow beam optics causing intense center peaks.
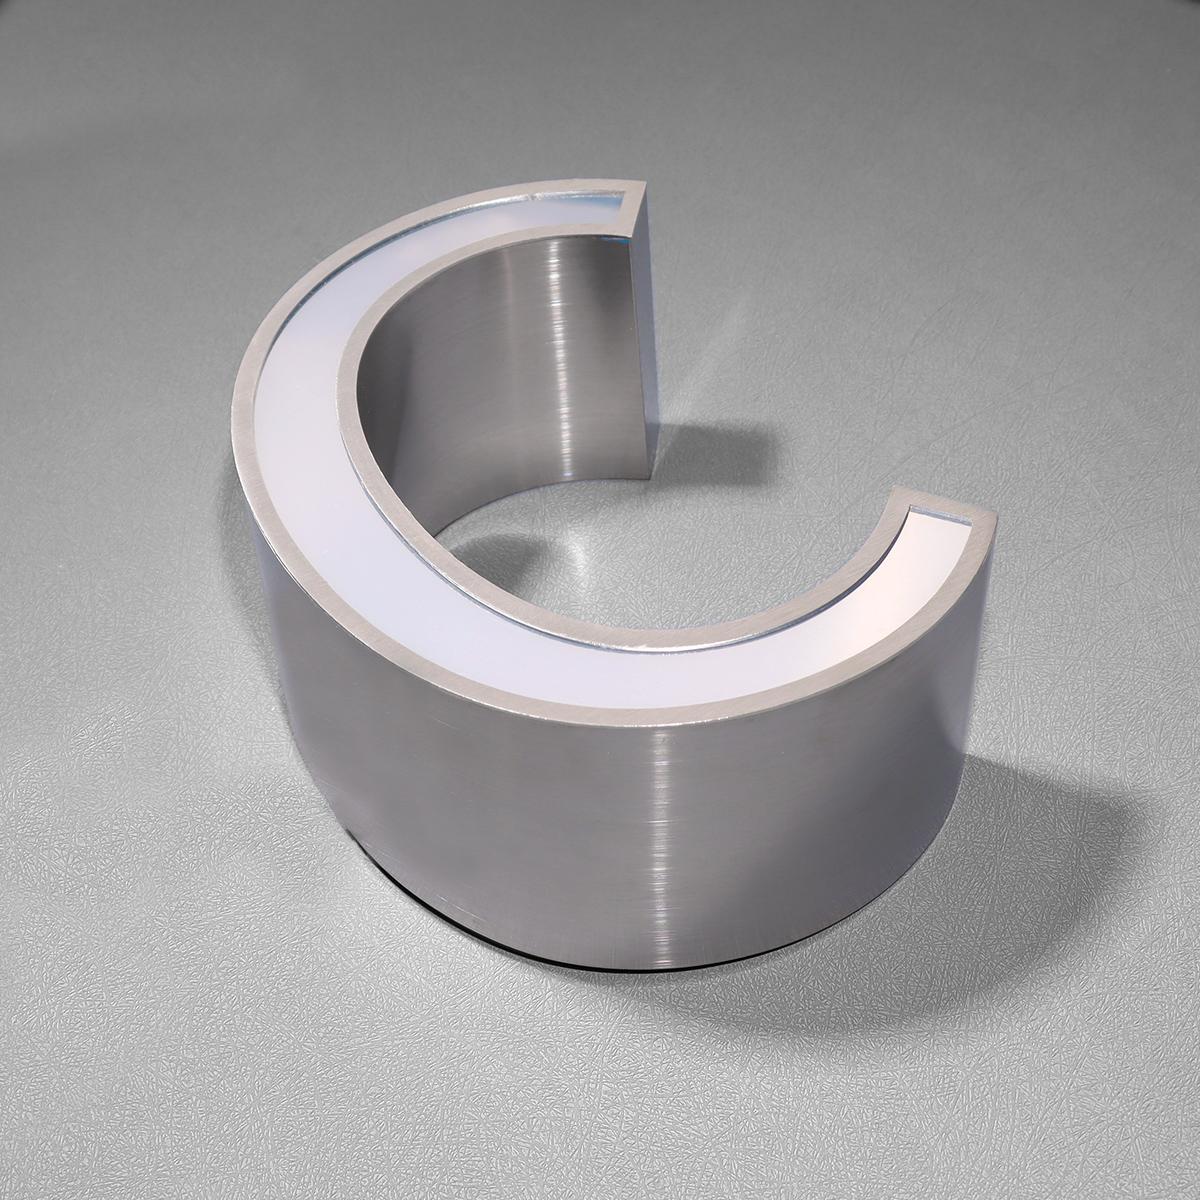
– Inadequate diffuser thickness or uneven diffuser material leading to visible lamp images.
– Poor thermal management reducing lumen maintenance and creating non-uniform aging.
Mitigations are straightforward: select wider beam angles or secondary diffusers, increase facing distance between LEDs and diffuser, and dimension heat sinks to keep junction temperatures low. Small adjustments to LED spacing often beat expensive optical fixes.
Integration with system-level wayfinding
Photometry solves the pixel-level problem; system design solves the routing and resilience problem. When linking illuminated panels to a broader digital wayfinding signage network or a cloud-fed digital wayfinding system—which handles content, scheduling, and dimming profiles—ensure that dimming curves respect the photometric baseline so content remains legible at night and during energy-saving modes. IP rating and control protocol compatibility matter here: IP65 enclosures and DALI or DMX control can preserve photometric intent across seasons.
Testing protocol and acceptance criteria
Set acceptance criteria before fabrication: target uniformity ratios (for example, max/min lux not worse than 3:1 across the sign face), minimum CRI for color-critical panels, and a lumen maintenance threshold over 25,000 hours. Run pre-installation lab checks, then verify in-situ with the same lux grid to close the loop. Field verification should include multiple angles and vehicle-speed considerations; a panel that looks even from a tripod at two meters can still produce hotspots at 20 km/h vehicle speeds if angle-dependent intensity spikes exist — simple but often missed.
Common mistakes and quick corrections
Designers often specify the brightest LED they can source; that produces contrast rather than clarity. Another mistake is trusting diffuser spec sheets without sample validation — materials vary batch to batch. Quick corrections include softening optics (add a microprismatic layer), re-spacing emitters, or tuning the current drive to flatten peaks — these are low-cost fixes before a full redesign.
Advisory: three golden rules for selection and verification
1) Validate photometric curves in the lab and require as-built lux maps for acceptance — do not accept vendor renderings alone. 2) Prioritize uniformity over peak brightness: readable signage at all approach angles beats a dazzling center. 3) Tie control capabilities (dimming profiles, ambient sensors) to measured baselines so the system reduces energy without creating new hotspots.
Testing against measurable criteria produces predictable results; for large campuses that predictability is operational value. Cosun Sign. —