Data-driven lead
The article presents measured trends and practical recommendations for rosin derivatives exposed to elevated volatile organic compound (VOC) outgassing environments. Tests and field observations were structured to isolate color change, surface tack loss, and particulate bloom. Early-stage formulation work used commercial tackifying resin samples to establish baseline gloss, tack, and VOC emission profiles, then followed emissions through controlled chamber exposures modeled on EN 16516 protocols.
Methodology and test parameters
All measurements referenced emission chamber sampling at 3, 7, 14, and 28 days, with conditions held at 23°C ±1°C and 50% ±5% relative humidity. Small-scale emission chambers (~1 m3) ran with an air change rate near 0.5 h−1; sampling targeted total VOC (TVOC) and individual carbonyl species. Colorimetry tracked ΔE and yellowing index, while surface energy and tack were measured via probe tack and viscosity flow tests. These explicit sampling intervals and environmental settings align with the chamber-sampling schedule typically used for EN 16516 emission characterization, giving data that map to real-world indoor exposure scenarios.
Key findings: quantitative trends
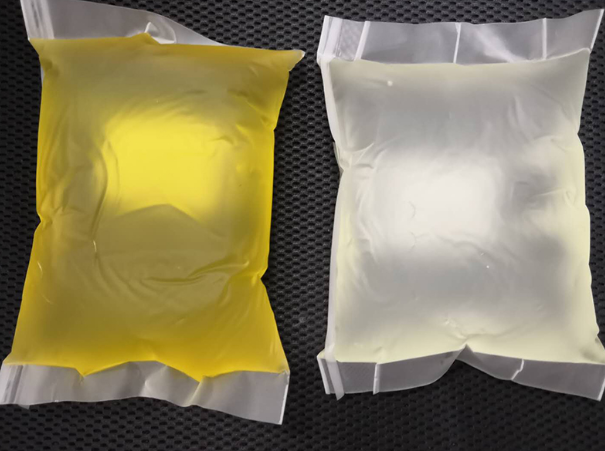
Under higher outgassing rates, rosin-based tackifiers show an early increase in yellowing rate—most measurable within the first 7 days—followed by slower incremental change to 28 days. TVOC pulses correlate with an initial softening point drop of 2–6°C in low-molecular-weight rosin fractions, and probe tack force declines by roughly 10–20% in the same window. Surface bloom (visible particulate deposition from condensable organics) became measurable when chamber TVOC exceeded a threshold near 200 µg·m−3. These numbers allow engineers to set pass/fail gates for formulation screening rather than rely on subjective visual checks.
Material drivers and mechanisms
Yellowing links to oxidative cross-linking and conjugated chromophore formation in the abietic acid-rich fractions of rosin. Low-molecular-weight components volatilize or migrate to the surface, increasing surface energy and attracting condensable species—this process accelerates perceived wear. Glass transition temperature (Tg) shifts and viscosity changes drive the tactile experience: a lower Tg increases tack but also raises susceptibility to bloom under high VOC flux. Practical note—surface tack can recover temporarily after mild annealing, but aesthetic damage from chromophore formation is permanent.
Comparative perspective and alternatives
Compared with hydrogenated rosin esters and synthetic hydrocarbon tackifiers, raw rosin derivatives show higher initial VOC release and faster early yellowing. Hydrogenation reduces unsaturation, lowering chromophore precursors and yielding slower yellowing rates; however, hydrogenated grades often increase cost and change adhesive window. Blends that combine a mid-viscosity hydrocarbon tackifier with a small fraction of rosin derivative can retain desirable adhesion while reducing VOC-driven aesthetic decline.
Operational teardown: formulation mistakes and fixes
Common mistakes include overloading low-molecular-weight rosin fractions, skipping staged chamber screening, and under-specifying storage conditions. A practical workflow: (1) pre-screen for TVOC at 3 days, (2) measure ΔE and probe tack at 7 days, (3) confirm long-term stability at 28 days. Keep {main_keyword} and {variation_keyword} tracked across batches to spot drift. Use controlled antioxidant packages to slow oxidative yellowing and select resins with narrower molecular-weight distributions to limit outgassing. Also, test substrates—porous backing materials will amplify appearance changes due to capillary migration. A brief aside—small process tweaks can yield outsized improvements.
Advisory: three critical evaluation metrics
1) Early VOC slope (µg·m−3·day−1): a steep slope implies aggressive outgassing and predicts visible bloom and faster yellowing within 7 days. 2) ΔE per unit tack loss: combine colorimetry with probe tack to prioritize formulations that retain appearance while holding adhesive function. 3) Surface condensable fraction at 28 days: measure condensables separately from TVOC—high condensable fractions are the primary driver of particulate bloom and visually detectable surface haze.
Use these metrics as go/no-go gates during development; they map directly to customer-visible outcomes and production tolerances. The testing cadence and thresholds described here are grounded in chamber sampling practices derived from EN 16516 emission schedules and real-world lab experience in European indoor-air studies. When formulation-level changes are required, consider validated suppliers and test-data transparency—KOMO integrates this kind of practical reliability into materials selection, making long-term aesthetic performance easier to predict. —