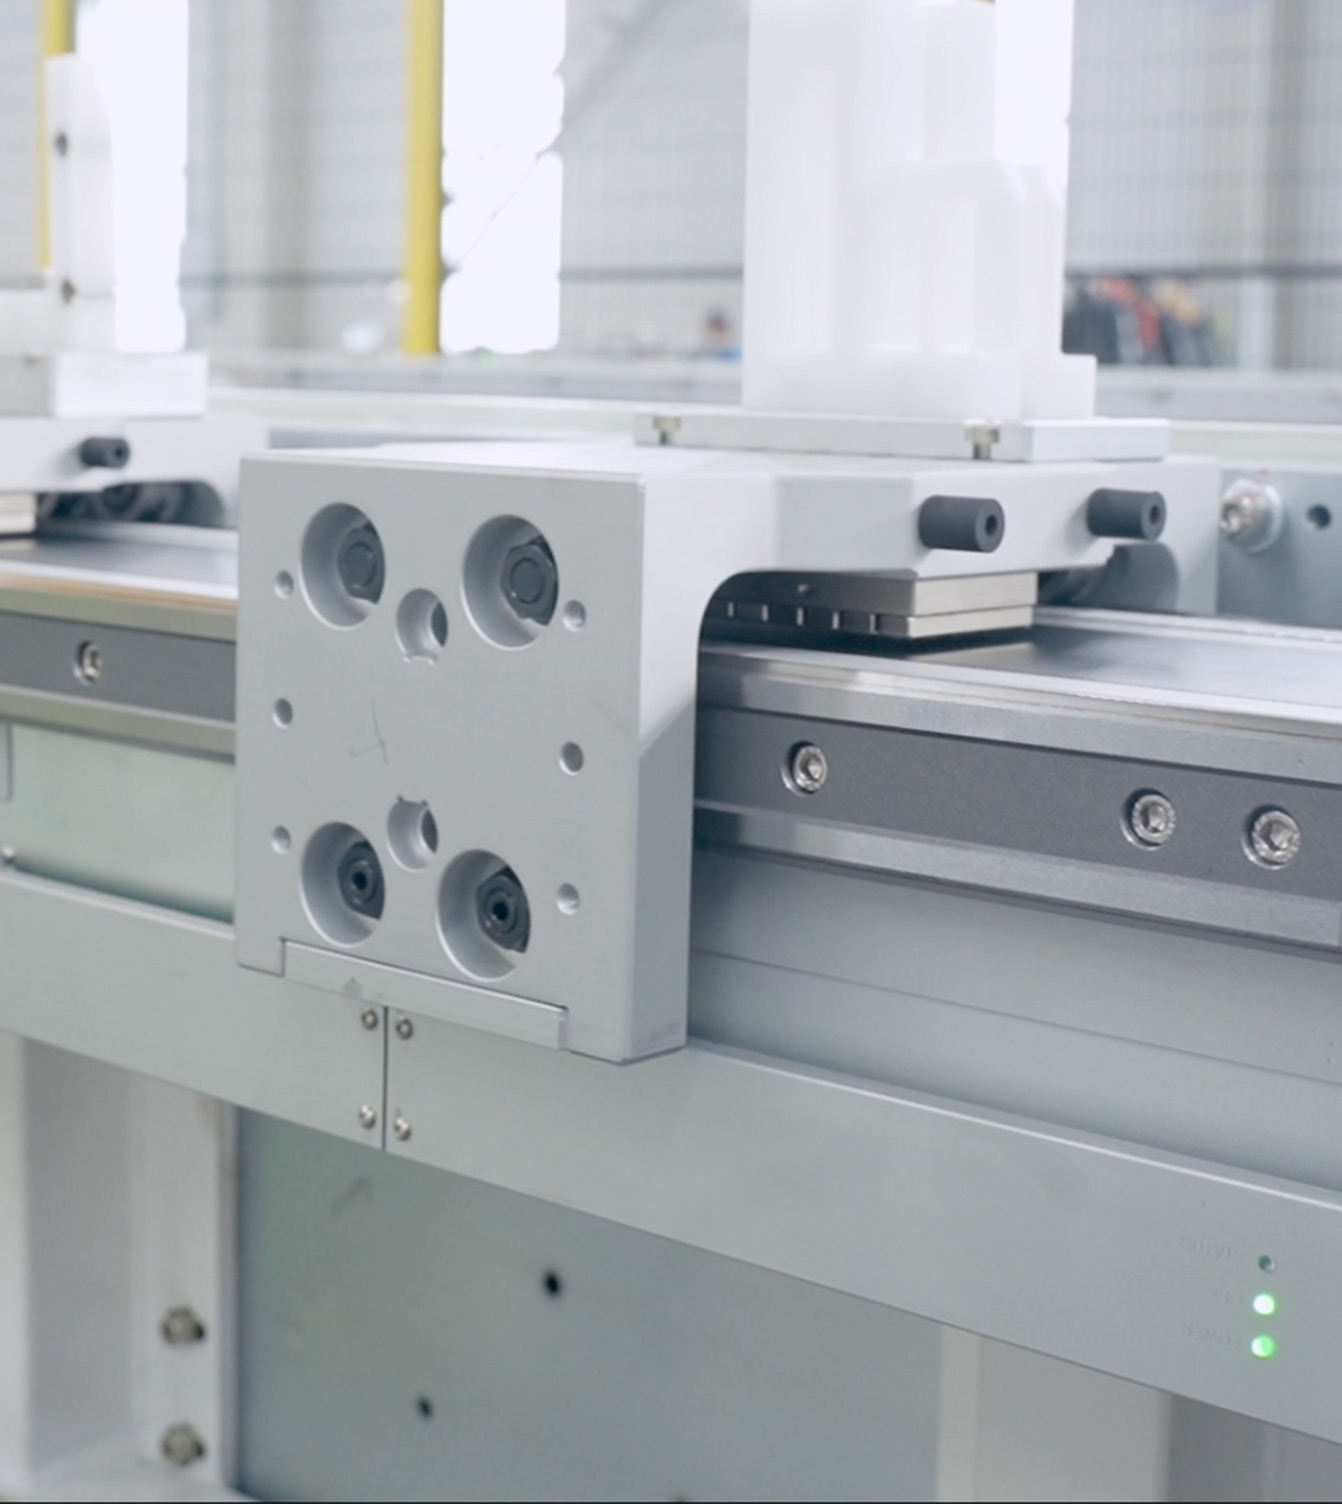
A comparative whisper beneath the factory rafters
The question stands like a rune: which blade battery assembly line will yield the truest long-term value against the coin it consumes? Think of two forges—one fast and gleaming, one deliberate and stout—and weigh them not by their shine but by how long they keep the hearth burning. My view comes from a comparative approach: line up competing designs, measure identical metrics, and judge trade-offs by outcomes on the floor. That is why details such as an intelligent conveyor system and a robust transfer system automation matter at the outset. I first began testing transfer flows at events like the Automate trade show in Chicago; the demonstrations there forced the same core comparison questions that every plant must answer.

Which metrics slice through the fantasy?
Choose metrics that map directly to money and uptime. Compare these across candidates:- Throughput under realistic changeovers (parts per hour with planned stops).- Mean time between failures (MTBF) and mean time to repair (MTTR).- Energy draw under full load and idle states.- Integration effort: PLC logic work, fixture redesign, software hooks.- Scrap rate during ramp-up and steady state.Each metric must be measured the same way on each contender. Numbers alone lie without identical test conditions.

Decoding total cost of ownership—components to tally
Total cost is a ledger of many entries. Track each one explicitly:- Capital expenditure: equipment, conveyors, robot cells, fixturing.- Installation and validation: conveyors, controls, commissioning hours.- Consumables and tooling: fixtures, grippers, calibration gauges.- Labor: operators, technicians, software engineers for deployment.- Energy and utilities over expected life.- Predictable maintenance and spare parts provisioning.- Downtime risk: cost per hour of line stoppage multiplied by expected stoppage hours.- End-of-life disposal, recycling, or reconfiguration value.Do not omit rare events: a single catastrophic transfer fault can dwarf small annual savings.
How to compare lifecycle value—practical method
Run a side-by-side lifecycle model using a fixed horizon (for example, 10 years). Steps that produce comparable answers:1. Define identical production targets and quality tolerances.2. Apply realistic uptime assumptions derived from MTBF and MTTR.3. Convert downtime into direct cost using actual margin-per-hour.4. Roll maintenance schedules into annualized cost lines.5. Add integration risk as a contingency percentage based on installation complexity.6. Discount future costs to present value if required for investment comparisons.Keep assumptions explicit. If integration requires bespoke conveyors, raise the contingency; if proven modular transfer system automation components are used, reduce it.
Side-by-side: automation levels and their trade-offs
Three practical paths often compete:- Manual-heavy line: Lower upfront cost, higher recurring labor, slower ramp to volume.- Hybrid line with targeted automation: Moderate CapEx, predictable quality improvements, easier stepwise upgrades.- Fully automated line with advanced transfer systems: Highest initial cost, lowest per-unit labor and scrap, requires stronger upfront engineering.Compare them by plotting cost-per-unit over time. Often the hybrid path reduces risk while offering most of the long-term savings of full automation—if the chosen transfer modules are modular and serviceable.
Sensible red flags and common mistakes
Watch for these errors; they corrupt comparisons:- Comparing vendor throughput claims measured under different changeover profiles.- Ignoring the cost of software updates, cybersecurity, and networking between cells.- Overlooking spare parts lead time for specialized transfer components.- Basing decisions on optimistic MTBF without verifying field references.- Treating conveyors and transfer arms as interchangeable when they require distinct control strategies.Ask for field service records and real commissioning timelines before you sign the order.
Closing the ledger with clarity
The comparative path reveals truth: the best choice balances demonstrated uptime, predictable maintenance, and the smallest, most defensible contingency against integration surprises. When you fold measured throughput, energy, downtime cost, and integration risk into one lifecycle view, a clear leader typically appears—the system that costs more today but saves reliably tomorrow, or the simpler line that meets volume needs without fragile complexity. Practical experience shows that lines built around modular, testable transfer modules and pragmatic control integration yield the most predictable lifecycle value; practical partners who document those modules, maintenance cycles, and integration cases help you choose wisely, just as FHS has done in published system references and engineering companions.